Better-For-You Cuisine
 Josh Patchus / Chief Data Scientist at Cava Grill
Cava is a rapidly expanding fast casual restaurant and CPG brand focusing on delivering a healthy and customized guest experience. Cava’s culinary-driven brand has fresh and better-for-you cuisine offering smart choices for each customer.
"Shiny is in this rare space of being very functional, while still being very customizable. A lot of tools limit the user to a set of graphs and a set of data manipulation tasks. Shiny on the other hand provides a framework that a user can work with to create extra features.”
- Josh Patchus, Chief Data Scientist at Cava Grill
In an industry not normally entrenched in data, delivering insight to the management team in an easy to consume and secure way can be difficult. Josh Patchus, the Chief Data Scientist at Cava Grill, knew that he needed to be powerful, secure, easy to navigate and easy to change approach. “Over the years I’ve learned a tool can be very powerful, but if it doesn’t look pretty and is hard to use, adoption rates will be terrible.”
Josh wanted to deliver a curated, intuitive data experience where parameters for models could be changed easily by managers. Not only did the visualization of the data need to be stunning and provide insight, it had to let Josh control access.
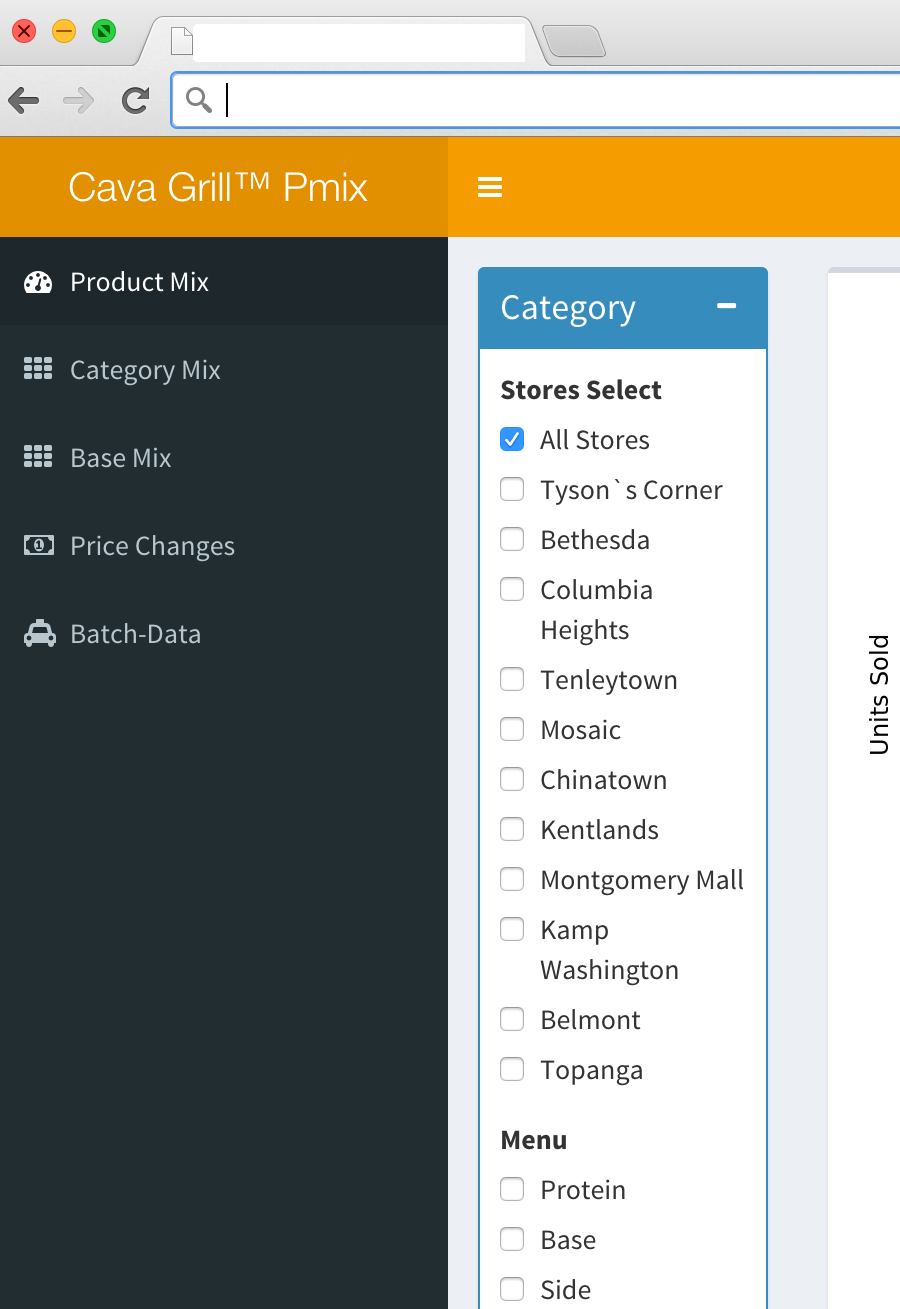
“When I found the dashboard examples page I literally said to myself: ‘This is what I’ve been looking for.’ The customizability was truly amazing.
Being able to have dashboards within dashboards was very helpful to Cava. “We want our analyst to go to one page and only worry about one set of dashboards. Shiny makes this easy.”
User authentication was a critical requirement for Cava. With RStudio Shiny Server Pro authentication features, each application provides the customized data access employees need for their job. “We are able to slice our dashboards into several user levels, allowing Managers to have their own set of dashboards, and control access to subdomains like ‘Finance’, ’Stores’, ’Marketing’, and ‘Supply Chain.'”
“The other rare feature we needed in an analytic tool which RStudio helped address is the ability for a user to explore amongst multiple variables. With the packages dpylr, tidyr, and ggplot2 this process is practically seamless. We can optimize our data any way we want”.
Cava appreciated that the RStudio team contributes code and creates many R packages to help make data connectivity, exploration, and manipulation very easy. Shiny, especially, provides a framework Cava’s data analysts use to create unique dashboards.
People adopt new tools when they enjoy using them. Visualizations and insights compel them to come back to Cava’s new dashboards. Using R, RStudio, Shiny, and Shiny Server Pro has allowed Cava to deliver on the promised curated experience. It allows people new to the data to see a static view (the default load), while allowing the more powerful data-savvy people to explore interactively. “Our Shiny app allows people to play around with the data to create findings of their own,” says Josh.
RStudio provides open source and enterprise-ready professional software for data science teams using R and Python.