
1. Transforming Iceland
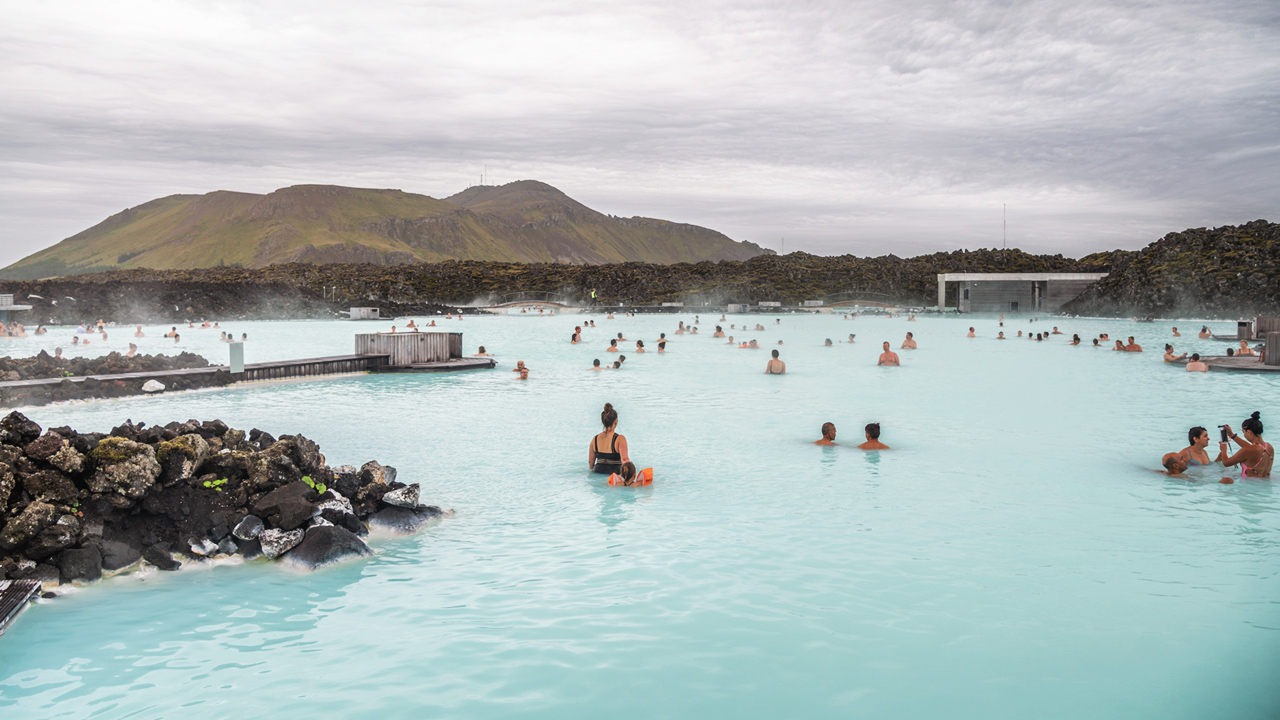
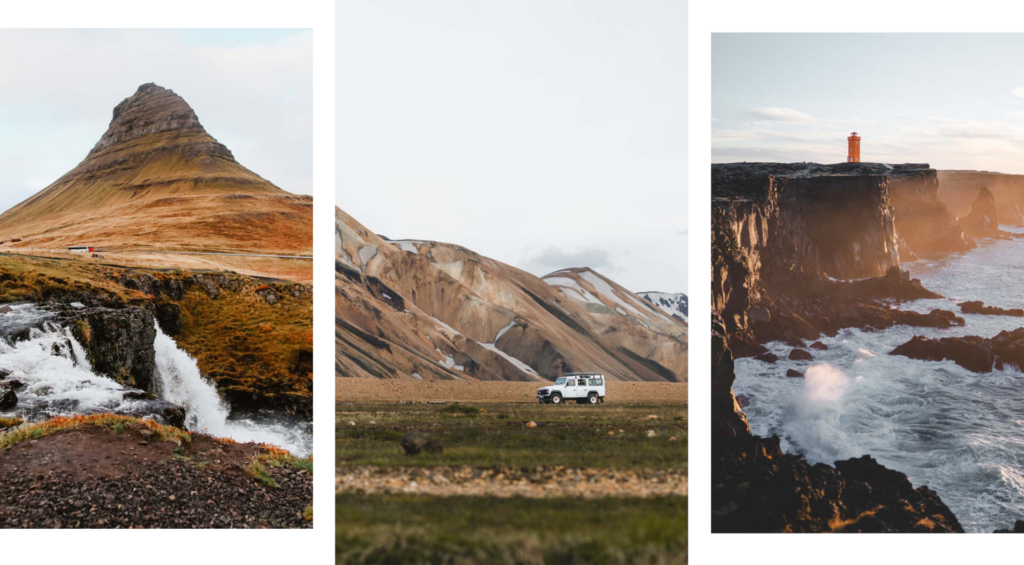
When you think of Iceland you imagine dramatic landscapes, the northern lights, and the Blue Lagoon. The ‘Land of Fire and Ice’ is home to natural beauty, yes, but it also has some of the top thinkers in science, environmental issues, and economics. In the capital city of Reykjavík, scientists are using data to impact the lives of citizens in many ways, including their swimming pool culture.
We sat down with Chief Data Officer Óli Páll Geirsson and his team in Reykjavík to learn more about their impact and how they’re using data science to better the lives of the citizens of their city. Reykjavík is transforming. Socially. Politically. Technologically. Important things are happening here. Óli’s contribution to this journey started two years ago.
“I saw in the newspaper, like a physical newspaper, that they were advertising the role of Chief Data Officer at the City of Reykjavík.” He was surprised. “First of all, what is paper, like what’s going on here? And the second thing: is the city really thinking about data on this scale? Are they really creating a position of Chief Data Officer?” Óli is quick to remind you of Iceland’s size. Less than 400,000 people live there, almost a third in Reykjavík.
"Pools are what people in Iceland do. It’s where they start their days, end their days, catch up with their fellow citizens."
Óli Páll Geirsson
Chief Data Officer
2. Social Swimming
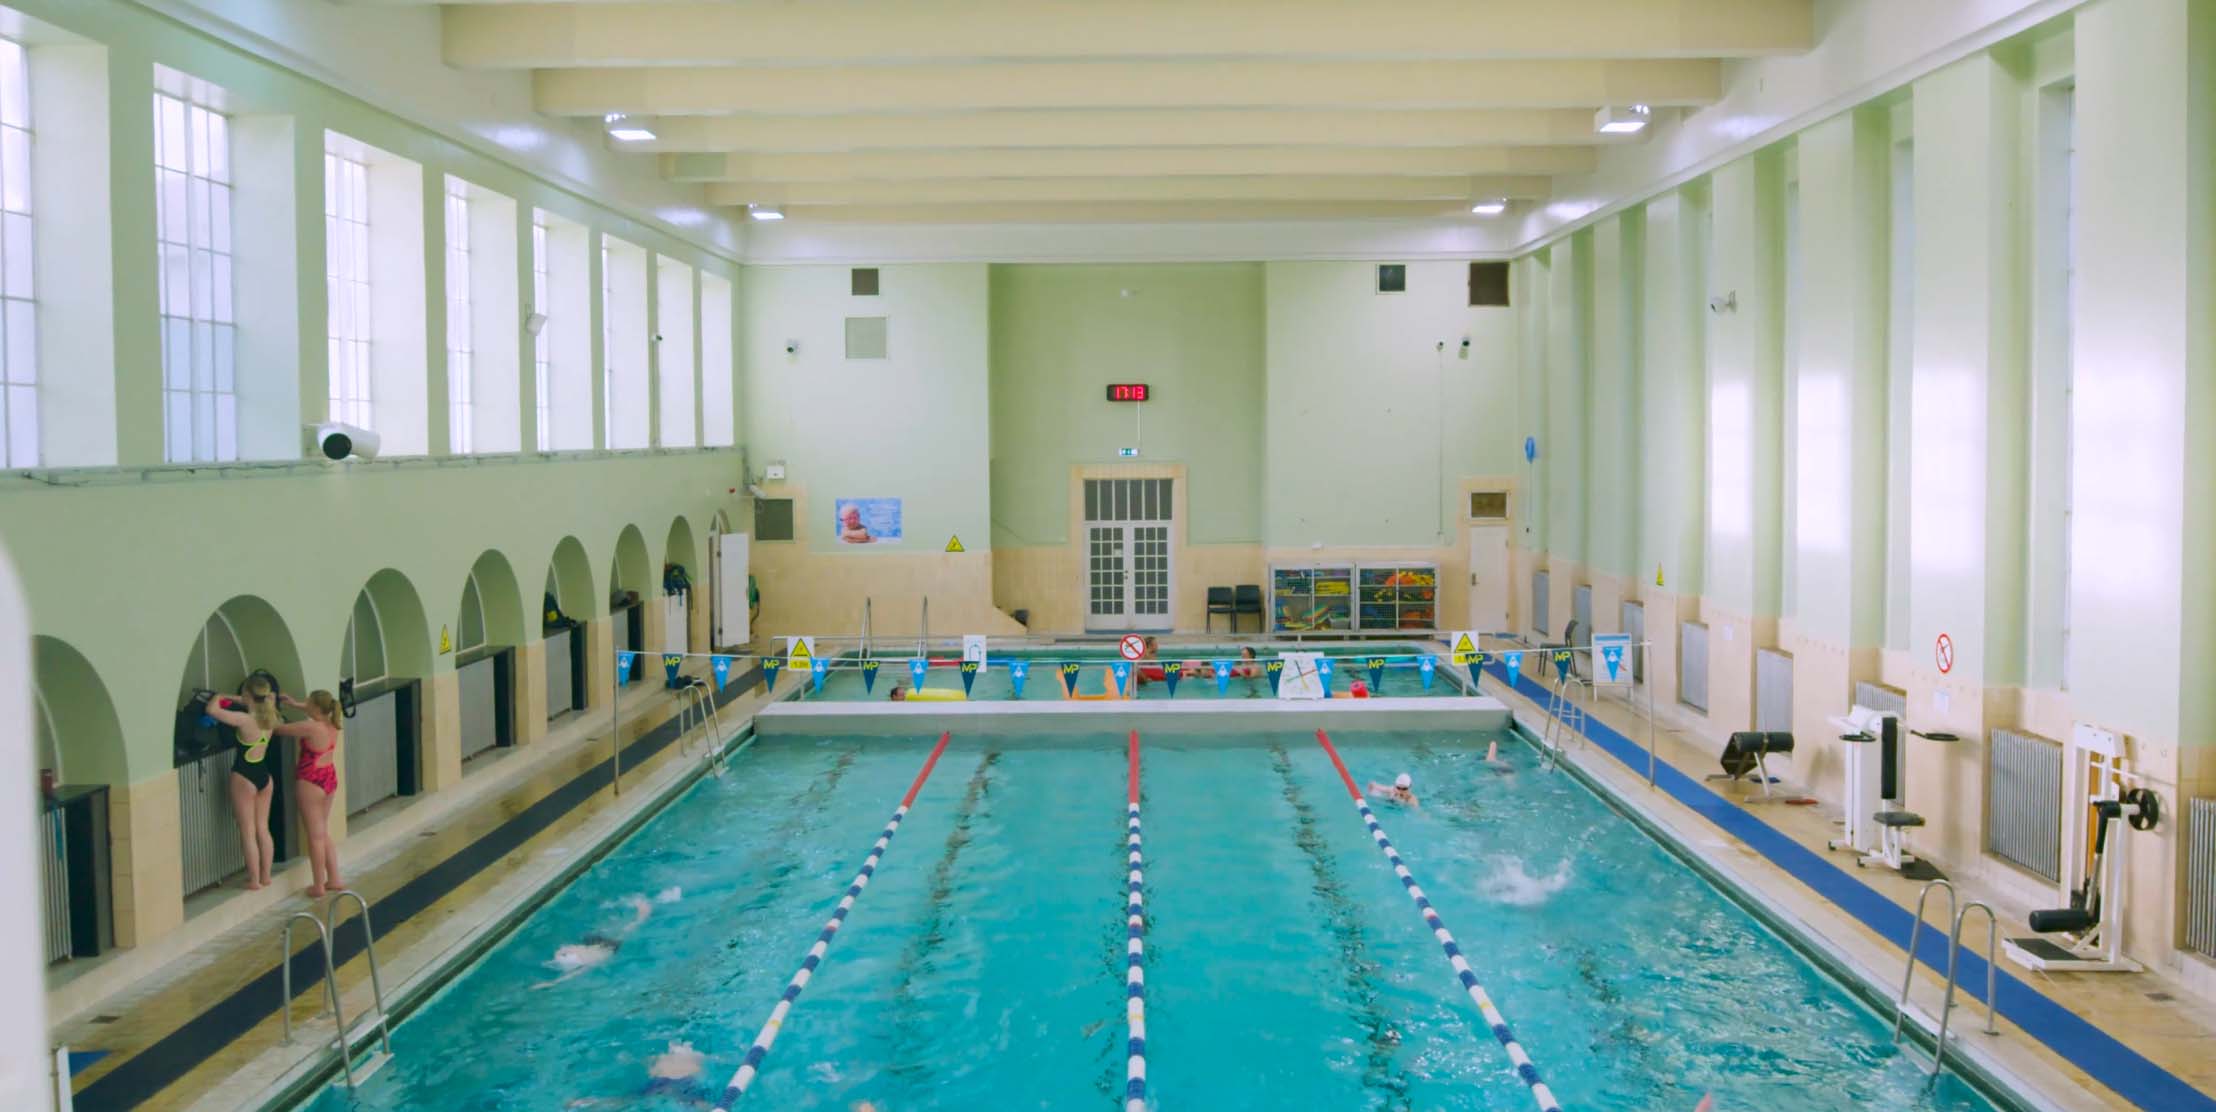
So what does one do on an arctic island where the winters are long and the summers are short? The obvious answer: pools.
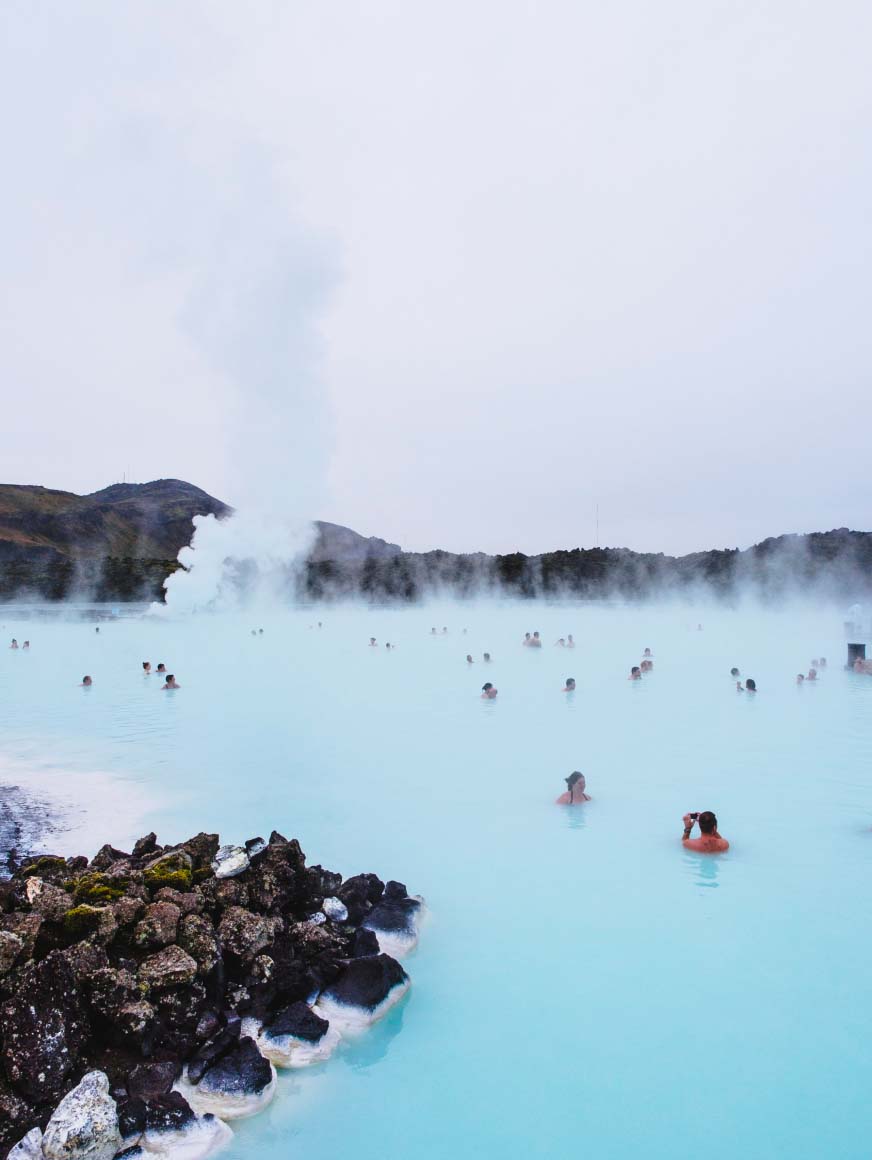
Not the kind that you’re thinking of – dirty, chlorine-filled tubs of water in uninspiring places. Pools in Iceland are beautiful. Therapeutic, hot bodies of water set against dramatic landscapes. They’re powered by geothermal energy, the result of Iceland’s convenient location on two tectonic plates.
Natural water in Iceland doesn’t need to be heated. It’s pumped out of the ground already at 80 degrees Celsius, or 176 degrees Fahrenheit. Pools are what people in Iceland do. It’s where they start their days, end their days, catch up with their fellow citizens.
“There’s a certain culture – a deep culture – ingrained with these swimming pools,” Óli says. “I can go into the hot tub and have a discussion with someone with a fancy title but is just there enjoying the moment. The fun thing is that you put aside your differences and your titles and you’re just there, experiencing the moment together. It’s really beautiful.”
In the winter months, sunset is only 4 hours after sunrise. 2 hours in some northerly towns. A consequence of this is vitamin D deficiency. Thermal pools offer a solution to this challenge. Icelanders, even on the coldest, darkest days, can go to the pool and strip themselves of their clothes, exposing their skin to what little sunlight is available. The hot water protects them from the freezing wind.
“There’s a certain culture - a deep culture - ingrained with these swimming pools,” Óli says
3. The data-driven idea
Before putting a team in place or setting any priorities, Óli had already thought about the impact he wanted to make. He loved the idea of doing something good for citizens, something of value. During his first few weeks, he cracked open the phone book and reached out to departments and citizens, pitching an idea to people that would listen: “We are going to use the power of data to enhance the quality of life for somebody. How amazing is that?”
Óli is big on conversations, on listening. He’s decidedly proactive about it. “We are not an institution that you come to. We are a service center that comes to you. It wouldn’t make any sense for a data science team to exist in a corner office alone, training models, and not having conversations with anybody.”
And if you ask citizens what they want, they’ll tell you. “I got frequent requests. Even phone calls.” Óli begins and laughs. “Why can’t I see how many guests are in each swimming pool right now?”
This is what the citizens of Iceland want to know: How crowded is a specific pool at a specific time?
"Why can’t I see how many guests there are in the swimming pool right now?"
Óli Páll Geirsson
Chief Data Officer
This is what the citizens of Iceland want to know: How crowded is a specific pool at a specific time?
If you’re not from Iceland, you might not understand just how valuable this information is. It would be like if foodies in New York could know how many available tables there were at popular restaurants, on a Saturday night, minutes before leaving and without any reservations. Or if tourists in Paris knew exactly how many people were visiting the Eiffel Tower at a moment in time.
Someone who wants to go to the pool to socialize doesn’t want to find it empty, and someone who wants to go the pool to relax in peace doesn’t want to sift through dozens or hundreds of people for a spot.
Like most data science problems, it’s a straightforward question that is fairly complex to answer. For one, how crowded a pool is depends on the pool’s size. It doesn’t do someone any good to tell them that there are twenty people in a pool if they don’t how big the pool is.
Adding to the complexity, the number of people at a specific pool at any given time is transient. People go to pools, enjoy their swim and relax…then they leave. A pool that is mostly empty at nine in the morning might be crowded by the time someone arrives thirty minutes later.
Pools, like other venues, experience peak hours and down hours, and these hours differ from pool to pool depending on where it’s located. A pool in downtown Reykjavík might be most crowded right after work on the weekdays, while a pool like The Blue Lagoon, outside of the capital city, might be more crowded on a Saturday morning.
4. Building a team
Óli’s ambition from the start was to build a team capable of handling challenges like this – data-savvy people with the willingness and grit necessary to find, ingest, transform, and operationalize data.
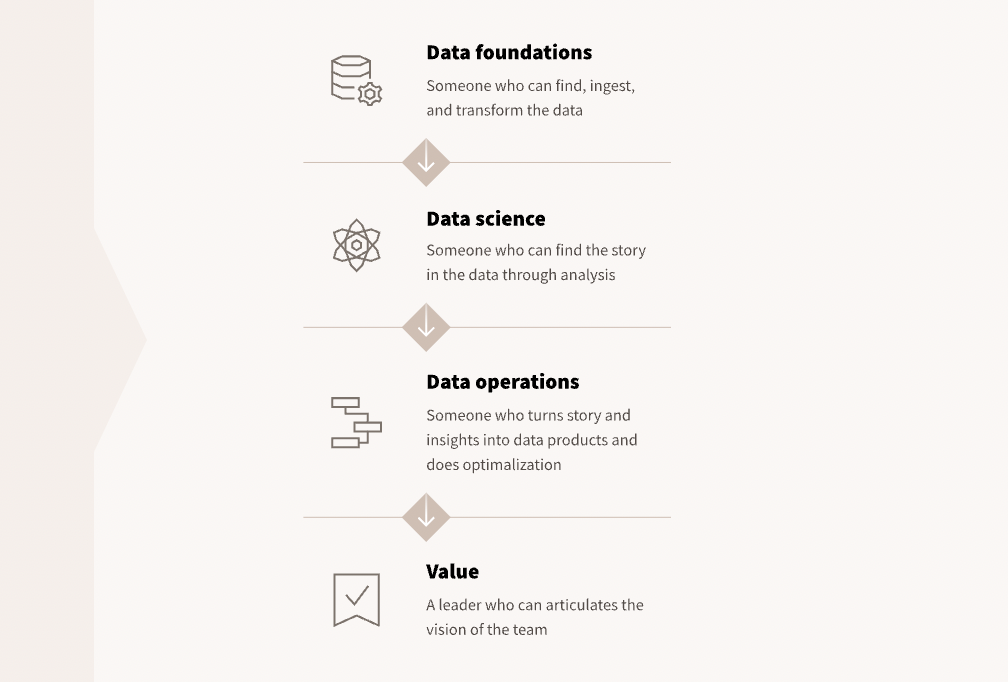
His first priority was to find someone who could establish a foundation. Someone who has a nose for finding data scattered across systems and departments, structured in different ways.
To fit the bill: Hlynur Hallgrímsson, Senior Data Scientist on Óli’s team. If Óli is the person building inroads to the data science team at the City of Reykjavík from other departments, it’s Hlynur who fills those roads with data.
He finds data sources in systems housed within other departments, then architects ways to ingest, store, and organize it all.
From there, he does something with the data, analyzing it to find stories and narratives that would interest stakeholders in other departments.
What does the Department of Welfare need to know about? What’s possible with the data that the Department of Leisure collects?
These are the stories that Óli and his team want to tell using data. To help them do that: Þorbjörn Þórarinsson, also a data scientist at the City of Reykjavík.
Þorbjörn specializes in operationalizing insights, finding beautiful and intuitive ways to articulate Hlynur’s analysis to stakeholders. He takes Hlynur’s models, analyses, and insights and packages them up into data products like Shiny Applications.
His goal is to make it easy as humanly possible for people who aren’t familiar with code or navigating data products to access their data in engaging, elegant ways.
To keep the trains running on time, Óli and his team have Inga Gunnarsdottir and Sigríður Friðgeirsdóttir. Inga is the team’s project manager. Sigríður is a data scientist, building internal applications for the team to use.
Together, Óli’s team has almost complete control over the data science value chain. They can find data, ingest it, analyze it, build beautiful data products, and share it all with stakeholders. The team is uniquely equipped to cover a lot of ground without needing additional support.
5. The workflow and infrastructure
The pool project started with a promise by the Department of Sport and Leisure:
“We have updated the gates at our swimming pools to modern electronic turnstiles. With these modern gates we can now get information on how many people are at each swimming pool through an API. Can you help us present this data?”
This pitch made it seem like the project would be simple. A gate would record when someone enters and leaves the pool. Data indicating the exact number of people in the pool would be readily available with a bit of configuration. All Hlynur would have to do is ingest this data using an API, clean it up, and figure out a way to express it visually with the help of Þorbjörn. Light work.
- Httr could be used to ingest the data
- Packages from the Tidyverse could be used to clean it
- Ggplot2 could be used to visualize it
- Shiny Application could be built for stakeholders to interact with the visualization
Of course, it wasn’t that simple. Hlynur assumed two things that ended up not being true. One, that the data would be readily available. All he would have to do is get it from the gates. And two, that the data actually measured how many people were in the pool at a given time, like the Department of Sports and Leisure promised. “It was a tragic miscalculation on my part”, Hlynur says.
There was disagreement over who owned the data. It was the view of the vendor who provided the gates that the data belonged to them, not the Department of Sports and Leisure. Óli and his team first requested the data in February of 2020. They didn’t receive access until February of 2021 after lawyers settled the conflict about ownership.

Regarding the quality of the data, after they received what the gates recorded, the data looked something like this:
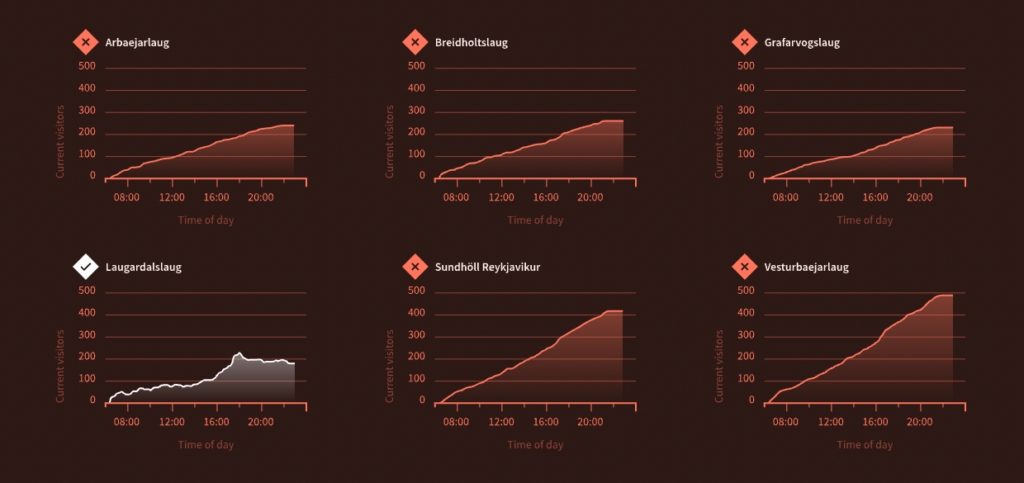
What you’re looking at are graphs that should be showing how many people are at each pool at a specific time on November 5th. What you’re actually looking at is the cumulative sum of people who visited the pool throughout the day. “You can see that for 5 of the 6 swimming pools in question, the number of people is strictly increasing.” adds Hlynur. This is obviously not right.
In turns out, the gates counted when people entered the pool. But they didn’t count when people left the pool. Only one swimming pool – Laugardaslaug – passed the eyeball test when Hlynur was looking at the data. It was the only pool that counted when people entered and left the pool.
The challenge was no longer as simple as ingesting data, organizing it, and then visualizing it. Hlynur and the rest of the team accepted that they would need to do real data science…make assumptions, build a model, validate the model, then operationalize it.
Building the model
The starting point for the model was the historical data from Laugardaslaug. Hlynur validated that the gates at Laugardaslaug, for the most part, recorded when people entered and left the pool, then made two assumptions:
Assumption number one:The durations of how long people stay at other pools are not inherently different from the duration that people stay at Laugardaslaug.
Assumption number two:There was nothing inherently different about the people who left and weren’t counted by the gate.
Given these two assumptions, Hlynur had an approach: “We can train a model based on historical Laugardaslaugh stay duration of people who were actually counted out, and then predict durations for people across the other five pools using live API data.”
"Predict durations for people across the other five pools using live API data."
Hlynur Hallgrímsson
Senior Data Scientist
Hlynur started on a local machine, reading the available historical duration data using R from Google Cloud. He then fit a linear model using a few predictors: the day of the week, the time of the day, and the month. Said differently, the model should account for if someone is at the pool at lunchtime in the summer versus on a Sunday morning in winter.
The resulting linear spline model was then published to Posit Connect. To operationalize the model for new data, Hlynur scheduled an R Markdown to run and ingest real-time data from the live API every five minutes, and then a Shiny application to read the data from the R Markdown document and run the model against it.
Said more simply: if you were to enter Laugardaslaug, your entrance time would be recorded by the gate. 5 minutes later, that data, along with all other entrance data collected during the five-minute window, would then be sent to a computational document. Hlnur’s model would then be applied to the data in that computational document and predict at what time you will leave Laugardaslaug.
6. Looking Forward
The grand mission of Óli’s team is to continue improving the lives of citizens through data. Some of the other successes so far include a data product that helps the Department of Welfare anticipate its service needs each week, an application that informs citizens exactly when their garbage is going to be collected, and an interactive map displaying where the nearest voting center is.
“How I see this going is we build up a portfolio of well-thought-out products aimed to serve the residents,” Óli says we ask about the future. “Together, they build up this better digital landscape for the residents of Reykjavik.”
This type of work is not optional, according to him. “We know that digital transformation is happening. We need to evolve with society. How can we as a city use data and data analytics to help people, to put down these barriers and walls, to improve the quality of life for the citizens of Reykjavik?” He really believes that Iceland can continue to push the boundaries of what’s possible with data science in the public sector, that the citizens that he serves are hungry for this type of progress.
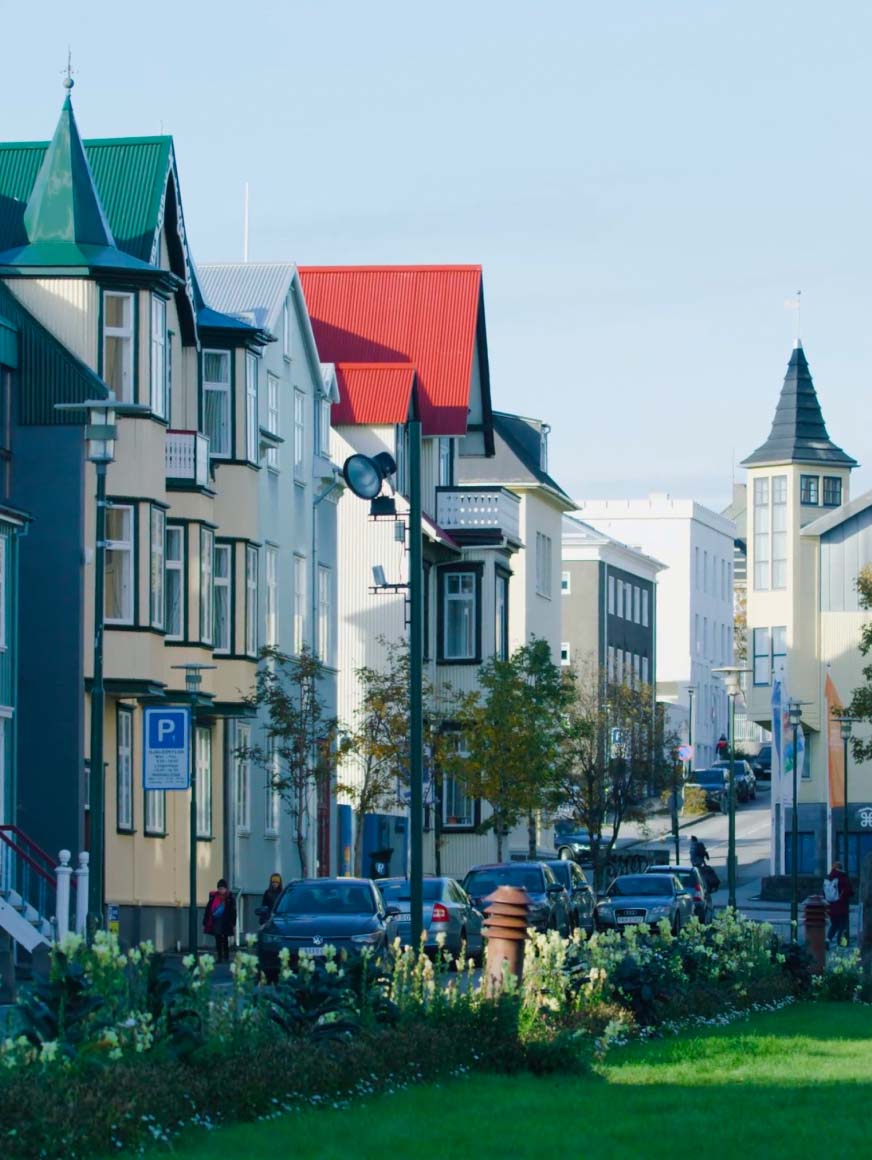
Reykjavik
"Together, they build up this better digital landscape for the residents of Reykjavik."
Óli Páll Geirsson
Chief Data Officer
We asked why open-source tools like R make this all possible. He zooms out and talks about trust, within his team, and with stakeholders. How his team needs to feel empowered to build things and deliver value quickly. How stakeholders need to actually see their decision-making desires come to life, not in 6 months after an initial conversation, but in 2 weeks.
The right technology allows Óli and his team to take a meeting with the Department of Culture in the morning, then build and share a prototype before the end of the day. “If you can deliver results and minimum viable products quickly, that’s so important for the conversations with stakeholders. And if you have a data product that you can show quickly, based on the needs you heard last week, that makes the conversation so much more meaningful and relatable to the stakeholder.” “Once we can deliver quickly, we can establish trust with stakeholders”, Óli says. He grins and adds, “The thing that I’m about to show, we just started building on Monday.”
Óli adds that most stakeholders are not data-savvy, especially in the public sector. It’s important not to overcomplicate things. Small, tangible things that add little bits of value are what build the case for data science.
“Digital transformation is about finding value propositions. You build up a product and it could be small, like our trash calendar or the swimming pool stuff. These things shine in their own right, like the stars that they are. Together, they form this constellation of products. That’s what it’s all about. A lot of small important things that build up holistically.”
Since sitting down with the data science team at the City of Reykjavík, Óli has taken a new role with Lucinity. He is still intensely involved in using data science to help the citizens of Iceland.
Inga is now the Chief Data Officer for the City of Reykjavík.